Case study: Thames Water sewage treatment capacity
This dataset contains an estimation of installed treatment capacity at Thames Water's 351 sewage treatment works in 2024.
Hull, M., Anderson, G., Hannam, M., Kingdom, B., Knowles, R. and Whysall, K. (2025). Turning the tide? An analysis of Thames Water's provision of wastewater services since privatisation, with wider conclusions and recommendations. Oxford Rivers Improvement Committee.
We share this so local communities, planning authorities and others have an indication of the capacity of your local sewage treatment works.
You could use this data to advocate for improvements in your local area. For instance, some new housing developments around Oxford have been prevented from being occupied before Oxford treatment works is upgraded, due to efforts from campaigners.
This dataset was created by the Oxford Rivers Improvement Campaign (ORIC), a volunteer group of independent researchers. Raw data was provided by Thames Water via Environmental Information Requests (EIRs). Using this data, ORIC calculated required capacity for a treatment works using an approved Environment Agency formula, and compared it to the known capacity.
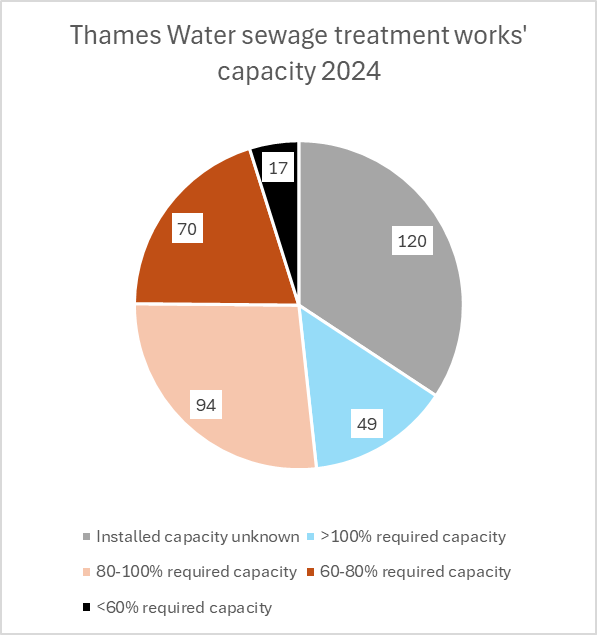
They calculate that 181 sewage treatment works had inadequate capacity to treat incoming flows of sewage (80% of all works with known capacity).
How to use this spreadsheet
This dataset has four datasheets:
1. EDM 2019 – 2024 discharges
This dataset shows the number and duration of untreated sewage spills from Thames Water assets in each year between 2019 and 2024 (inclusive).
EDM stands for "event duration monitor". These are the monitors installed on sewage overflows (also called "storm overflows" or sometimes "CSOs"). They monitor the duration of the spill event.
At the bottom of the spreadsheet, there are summary tables and graphs.
2. Required capacities
This dataset shows the installed treatment capacity for all 351 of Thames Water's sewage treatment works in June 2024, in litres per second (Column D). For 120 works, the installed treatment capacity is unknown.
Column K shows the required treatment capacity, in litres per second. This has been calculated by the researchers using a formula supplied by the Environment Agency, and variables like infiltration rate, population served, per capita consumption and trade effluent (Columns G – J).
Column P shows the ratio of the installed treatment capacity to the required capacity in 2024.
So, if this figure is 64%, it is estimated that the works only has capacity to treat 64% of incoming volumes of sewage. 0% figures indicate that the installed capacity is unknown. Columns Q – T are a projection of the ratio of installed to required capacity until 2040, based upon projected population growth.
3. Trend population growth
This sheet shows projected population trends for each of Thames Water's sewage works. It lists the population the works served in 2015, 2020 and 2024, and then projects the same level of population growth until 2024. These data are used to calculate the figures in the "required capacities" sheet.
4. Other exog. Variables
This dataset contains other variables used to calculate the "required capacities", e.g. infiltration rate, population, trade effluent and per capita consumption.
What is being done about this?
In May 2025, the water regulator Ofwat fined Thames Water £104.5 million for breaking environmental permit conditions at 157 of its sewage treatment works in 2021.
Ofwat found that "most of Thames Water's WWTW have storm overflows associated with them that spill regularly to the environment. In 2021, for example, over 70% of these storm overflows spilled on 20 or more occasions, with almost 30% spilling on more than 60 occasions. Thames Water has failed to demonstrate that these spills resulted from exceptional circumstances, or that it would have been excessively costly to address the spills from these storm overflows."
They concluded that Thames Water had failed "to operate and maintain its assets adequately, and to upgrade them where necessary".
See Thames Water's investment and upgrade plans for sewage works and storm overflow sites.