General
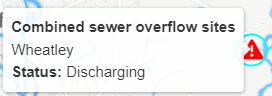
- Hover over icons to get the most recent reading / status
- Use the layers symbol
 to switch different layers on and off
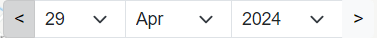
- Use the date finder in the top left to see previous days
Detailed view
- Clicking on an icon on the map will bring up a graph with data back to January 2021
- Hover over data points on the graph for readings
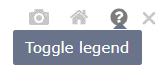
- Use the list icon () to toggle the legend
- Use the date slider to choose a date range, or zoom in by selecting an area of the graph
- Selecting multiple icons will bring up graphs stacked on top of each other
Oxford Rivers Data Portal
View