General
Find up-to-date information about our local rivers, stay safe, and help make them healthy again.
The standard view shows live sewage spill alerts and river levels.
Check out the case studies, and the Understanding in the data pages to find out more.
- Hover over icons to get the most recent reading / status
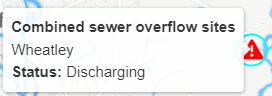
- Use the layers symbol
 to switch different layers on and off
- Use the date finder in the top left to see previous days

Detailed view
- Clicking on an icon on the map will bring up a graph with data back to January 2021
- Hover over data points on the graph for readings
- Hover over each variable to find out more information. You can also turn different variables on and off by clicking them in the legend.
- Use the list icon () to toggle the legend
- Use the date slider to choose a date range, or zoom in by selecting an area of the graph
- Use the home icon to reset the axes and the ? button to see more information about the different variables.
- Selecting multiple icons will bring up graphs stacked on top of each other. This way, you can select different datasets directly.